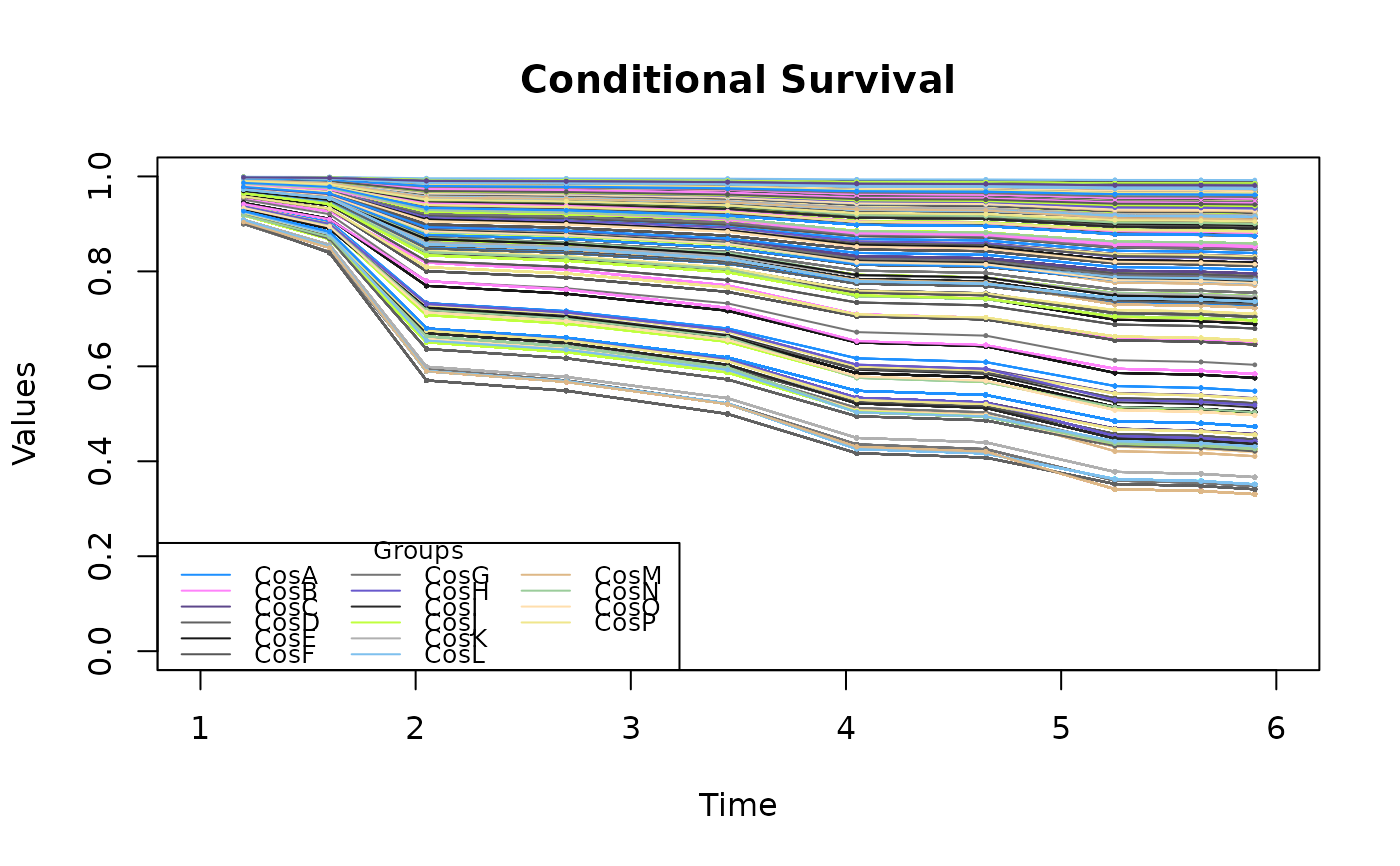
Plot of Conditional Survival Function
plot_survivalAdPaik.Rd
Plots the conditional survival function based on the 'Adapted Paik et al.' model's estimated coefficients and frailty effects, for each unit in each time interval (represented by its mid point).
Arguments
- result
S3 object of class 'AdPaik' containing model results.
- lwd
The line width of the plot. Default is 1.
- xlim
A numeric vector specifying the range for the x-axis (intervals). Default is min-max value of the time domain.
- ylim
A numeric vector specifying the range for the y-axis (intervals). Default is the range 0-1.
- xlab, ylab
String giving the x and y axis name. Default values are 'Time' and 'Values'.
- main
Title of the plot. Default title is 'Survival'.
- cex
Dimension of the points used for plotting the estimates. Defaults to 0.2.
- cexlegend
Dimension of the text used for the legend. Defaults to 0.9.
Examples
# Import data
data(data_dropout)
# Define the variables needed for the model execution
eps_paik <- 1e-10
categories_range_min <- c(-8, -2, eps_paik, eps_paik, eps_paik)
categories_range_max <- c(-eps_paik, 0.4, 1 - eps_paik, 1, 10)
time_axis <- c(1.0, 1.4, 1.8, 2.3, 3.1, 3.8, 4.3, 5.0, 5.5, 5.8, 6.0)
formula <- time_to_event ~ Gender + CFUP + cluster(group)
# Call the main model function
# \donttest{
result <- AdPaikModel(formula, data_dropout, time_axis, categories_range_min, categories_range_max)
#> Error in while (r <= n_run & actual_tol_ll > tol_ll) { if (verbose) message(paste("Run ", r)) RemainingIndexes <- RunIndexes[r, ] UsedIndexes <- c() while (length(RemainingIndexes) != 0) { index_to_vary <- RemainingIndexes[1] PosIndex <- which(RemainingIndexes == index_to_vary) RemainingIndexes <- RemainingIndexes[-PosIndex] UsedIndexes <- c(UsedIndexes, index_to_vary) result_optimize <- suppressWarnings(optimize(ll_AdPaik_1D, c(params_range_min[index_to_vary], params_range_max[index_to_vary]), maximum = TRUE, tol = tol_optimize, index_to_vary, params, dataset, centre, time_axis, dropout_matrix, e_matrix)) params[index_to_vary] <- result_optimize$maximum } global_optimal_params[r, ] <- params global_optimal_loglikelihood_run <- ll_AdPaik_eval(params, dataset, centre, time_axis, dropout_matrix, e_matrix) global_optimal_loglikelihood[r] <- global_optimal_loglikelihood_run if (is.nan(global_optimal_loglikelihood_run)) stop("NaN value for the optimal log-likelihood value.") if (print_previous_ll_values[1]) { n_previous <- print_previous_ll_values[2] if (r < n_previous) if (verbose) message(paste(" Global log-likelihood: ", global_optimal_loglikelihood[1:r])) else if (verbose) message(paste(" Global log-likelihood: ", global_optimal_loglikelihood[(r - n_previous + 1):r])) } actual_tol_ll <- abs(ll_optimal - global_optimal_loglikelihood_run) if (ll_optimal < global_optimal_loglikelihood_run) { ll_optimal <- global_optimal_loglikelihood_run optimal_run <- r } r <- r + 1}: missing value where TRUE/FALSE needed
plot_survivalAdPaik(result)
#> Error: object 'result' not found
# }